

SUMMARY
Mastering PostgreSQL for Backend Development: Performance & Scalability in 2026
Dive deep into optimizing PostgreSQL for your backend applications, ensuring peak performance and robust scalability.
Keywords: PostgreSQL, Backend Performance, Database Scalability
TABLE OF CONTENTS
1. Introduction: PostgreSQL’s Enduring Relevance in 2026
2. Core Content: Deep Dive into PostgreSQL Performance Tuning
3. Problem Solving: Addressing Advanced Scalability Challenges
4. Practical Application: Best Practices for Backend Developers
5. Frequently Asked Questions
INTRODUCTION
PostgreSQL’s Enduring Relevance in 2026
In the rapidly evolving landscape of backend development, the choice of a database remains a foundational decision. As we navigate 2026, PostgreSQL continues to stand out as a robust, reliable, and highly extensible relational database management system (RDBMS). Its open-source nature, coupled with a vibrant community and a feature set that often rivals proprietary solutions, makes it a top contender for a vast array of applications, from small startups to enterprise-level systems handling billions of transactions daily.
However, merely choosing PostgreSQL isn’t enough. The true power of this database is unlocked through meticulous optimization and a deep understanding of its architecture, especially when building scalable backend services. With increasing user demands, ever-growing data volumes, and the constant pressure for sub-second response times, backend developers in 2026 must be masters of PostgreSQL performance tuning and scalability strategies. Neglecting these aspects can lead to sluggish applications, frustrated users, and costly infrastructure overhauls.
“PostgreSQL’s versatility and extensibility make it a cornerstone of modern backend systems, but its true potential is only realized through expert optimization.”
This report aims to guide you through advanced techniques and best practices to ensure your PostgreSQL-powered backend applications are not just functional, but exceptionally performant and scalable in 2026. We’ll delve into everything from intricate indexing strategies and query optimization to critical database configuration and horizontal scaling patterns.
KEY POINT
Proactive PostgreSQL optimization is not a luxury, but a necessity for any backend application aiming for high performance and sustained user satisfaction in 2026. Early planning and continuous monitoring are crucial.
CORE CONTENT
Deep Dive into PostgreSQL Performance Tuning
Optimizing PostgreSQL involves a multi-faceted approach, touching upon schema design, query construction, indexing, and server configuration. Let’s break down the core components that drive performance.
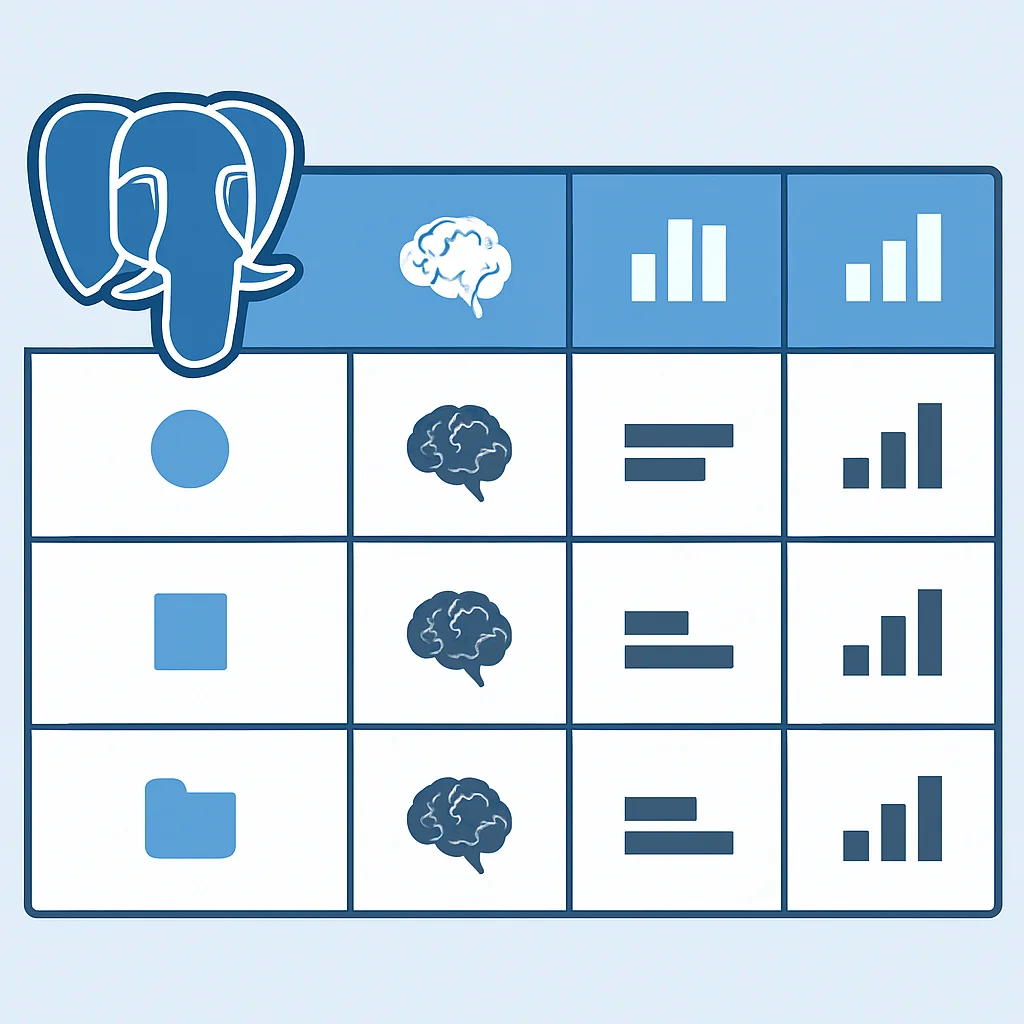
1. Strategic Indexing: The Foundation of Fast Queries
Indexes are your database’s roadmap, allowing it to quickly locate data without scanning entire tables. However, inappropriate or excessive indexing can hurt write performance and consume storage. The key is strategic indexing.
B-tree Indexes: These are the default and most common index type, ideal for equality and range queries on ordered data. They are perfect for primary keys, foreign keys, and columns frequently used in WHERE, ORDER BY, and JOIN clauses.
GIN (Generalized Inverted Index) Indexes: Essential for full-text search and complex data types like JSONB, arrays, and tsvector. GIN indexes store a list of locations for each unique value, making them highly efficient for finding rows containing specific elements within these complex types.
GiST (Generalized Search Tree) Indexes: Designed for indexing non-standard data types and queries, such as geometric data, full-text search (though GIN is often preferred for tsvector), and range types. They are extensible, allowing developers to implement custom indexing strategies.
BRIN (Block Range Index) Indexes: Ideal for very large tables where data is naturally ordered (e.g., a timestamp column in an append-only log table). They are very small and fast to create, storing minimal metadata about value ranges within physical block ranges.
CODE EXPLANATION
Below are examples of creating different types of indexes. We’re creating a B-tree index on user_id for fast lookups, a GIN index on a jsonb column for efficient querying of document data, and a BRIN index on a created_at timestamp for large, naturally ordered tables.
-- B-tree index for common lookups
CREATE INDEX idx_users_email ON users (email);

-- GIN index for JSONB column on 'settings'
CREATE INDEX idx_products_tags ON products USING GIN (tags);

-- BRIN index for a large, time-series table
CREATE INDEX idx_logs_created_at ON logs USING BRIN (created_at);

-- Partial index for active users
CREATE INDEX idx_active_users_last_login ON users (last_login) WHERE is_active = TRUE;

-- Covering index (PostgreSQL 11+) to avoid heap fetches for specific queries
CREATE INDEX idx_orders_customer_total ON orders (customer_id) INCLUDE (total_amount, order_date);
Partial Indexes: These index only a subset of rows in a table, specified by a WHERE clause. They are smaller, faster to maintain, and can be very effective for queries on frequently accessed “active” data (e.g., active users, pending orders).
Covering Indexes (PostgreSQL 11+): Using the INCLUDE clause, you can add non-key columns to an index. This allows certain queries to be answered entirely by the index, avoiding the need to access the table’s main data (heap), significantly speeding up read operations.
KEY POINT
While indexes boost read performance, they add overhead to write operations (INSERT, UPDATE, DELETE) and consume disk space. Regularly review index usage with pg_stat_user_indexes and remove unused indexes.
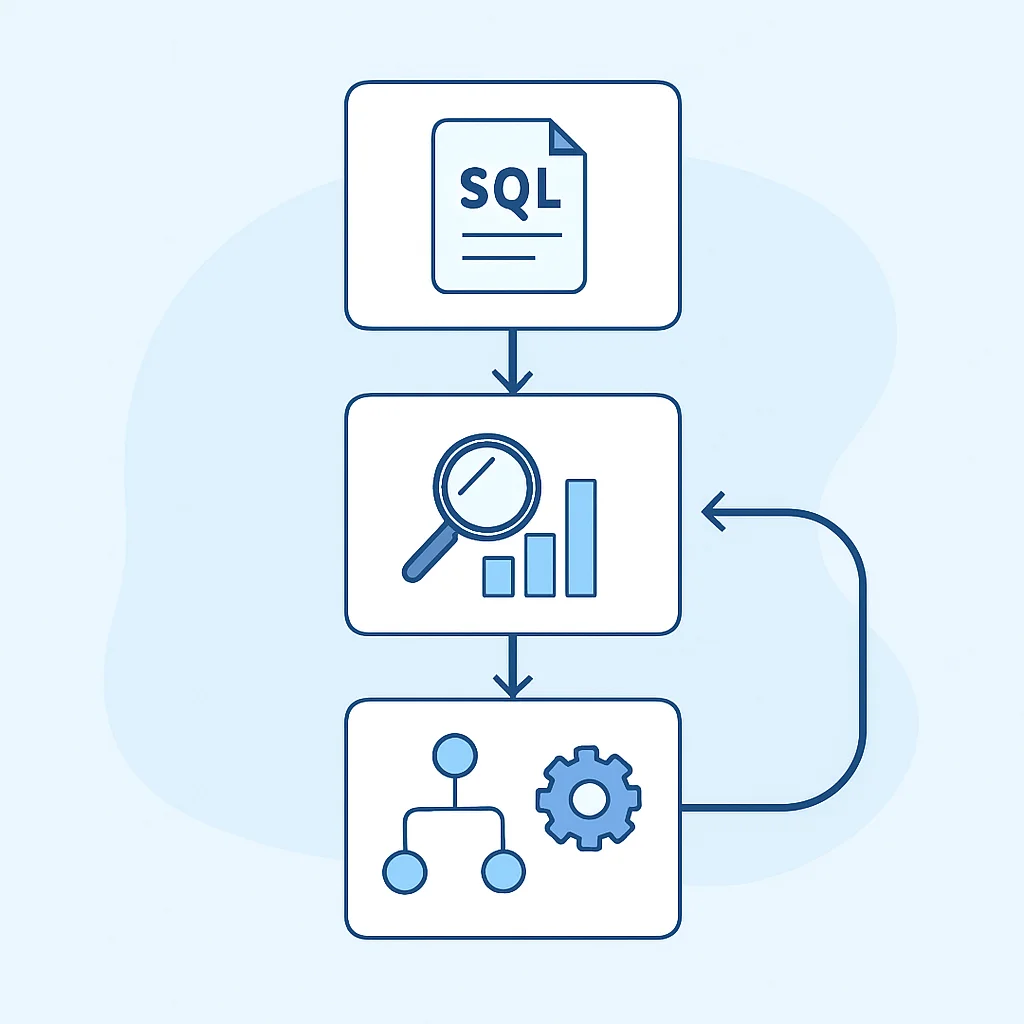
2. Query Optimization: Crafting Efficient SQL
Even with perfect indexing, poorly written queries can cripple performance. Understanding how PostgreSQL’s query planner works is paramount.
EXPLAIN ANALYZE: Your Best Friend: This command shows the execution plan of a query and, with ANALYZE, executes it, providing actual runtime statistics. It’s indispensable for identifying bottlenecks like sequential scans, expensive joins, or inefficient sorts. Look for high “rows removed by filter” or “rows removed by join filter” counts, indicating inefficient filtering.
CODE EXPLANATION
This EXPLAIN ANALYZE example demonstrates how to profile a query retrieving recent orders for a specific customer. The output will detail the execution steps, including index usage, join methods, and actual timings, helping to pinpoint performance issues.
EXPLAIN ANALYZE
SELECT o.order_id, o.order_date, o.total_amount, c.customer_name
FROM orders o
JOIN customers c ON o.customer_id = c.customer_id
WHERE o.customer_id = 12345
AND o.order_date > '2026-01-01'
ORDER BY o.order_date DESC
LIMIT 10;
Common Pitfalls:
- N+1 Queries: A classic ORM problem where fetching a list of parent objects leads to N additional queries to fetch child objects. Use eager loading or
JOINs to fetch all related data in one go. - Implicit Type Conversions: Applying functions to indexed columns in
WHEREclauses (e.g.,TO_CHAR(date_col) = '2026') can prevent index usage. Refactor to use index-friendly conditions (e.g.,date_col BETWEEN '2026-01-01' AND '2026-12-31'). - Wildcard at Start of
LIKE:LIKE '%searchterm%'prevents B-tree index usage. For full-text search, usetsvectorand GIN indexes.
Advanced SQL Constructs:
- Common Table Expressions (CTEs) with
WITH: Improve readability and can sometimes optimize complex queries by breaking them into logical, reusable blocks. - Window Functions: Perform calculations across a set of table rows that are related to the current row, without grouping the rows. Excellent for ranking, running totals, and moving averages.
- Materialized Views: Store pre-computed results of complex queries, significantly speeding up reads on frequently accessed aggregates or reports. Remember to refresh them periodically.
3. Database Configuration Tuning (postgresql.conf)
The postgresql.conf file contains crucial parameters that dictate how your PostgreSQL server utilizes system resources. Tuning these is vital for optimal performance.
shared_buffers: This is the most critical parameter. It sets the amount of memory dedicated to caching data blocks. A common recommendation is to set it to 25% of your total system RAM, but for systems with abundant RAM (e.g., >64GB), 8-16GB might be sufficient to avoid excessive OS page caching conflicts. For example, on a server with 32GB RAM, setting shared_buffers = 8GB is a good starting point.
work_mem: Specifies the amount of memory to be used by internal sort operations and hash tables before writing to temporary disk files. If you have complex queries with large sorts or hash joins, increasing this can prevent disk I/O. A value of 64MB to 256MB per session is often suitable, but be mindful of the number of concurrent sessions (total work_mem usage can be max_connections * work_mem).
maintenance_work_mem: Used for maintenance operations like VACUUM, CREATE INDEX, and ALTER TABLE ADD FOREIGN KEY. Larger values here can significantly speed up these operations. A common setting is 256MB to 1GB.
wal_buffers: The amount of shared memory used for WAL (Write-Ahead Log) data that has not yet been written to disk. Increasing this can reduce WAL writes, especially under heavy write loads. A value of 16MB is a good starting point, up to 64MB for very high write throughput.
max_connections: Sets the maximum number of concurrent connections. Each connection consumes memory, so set this to a reasonable number based on your application’s needs and available server resources. Typically, 100-500 is common for backend applications, often managed by a connection pooler.
KEY POINT
Always test configuration changes in a staging environment before applying them to production. Use tools like pgTune as a starting point, but fine-tune based on your specific workload and monitoring data.
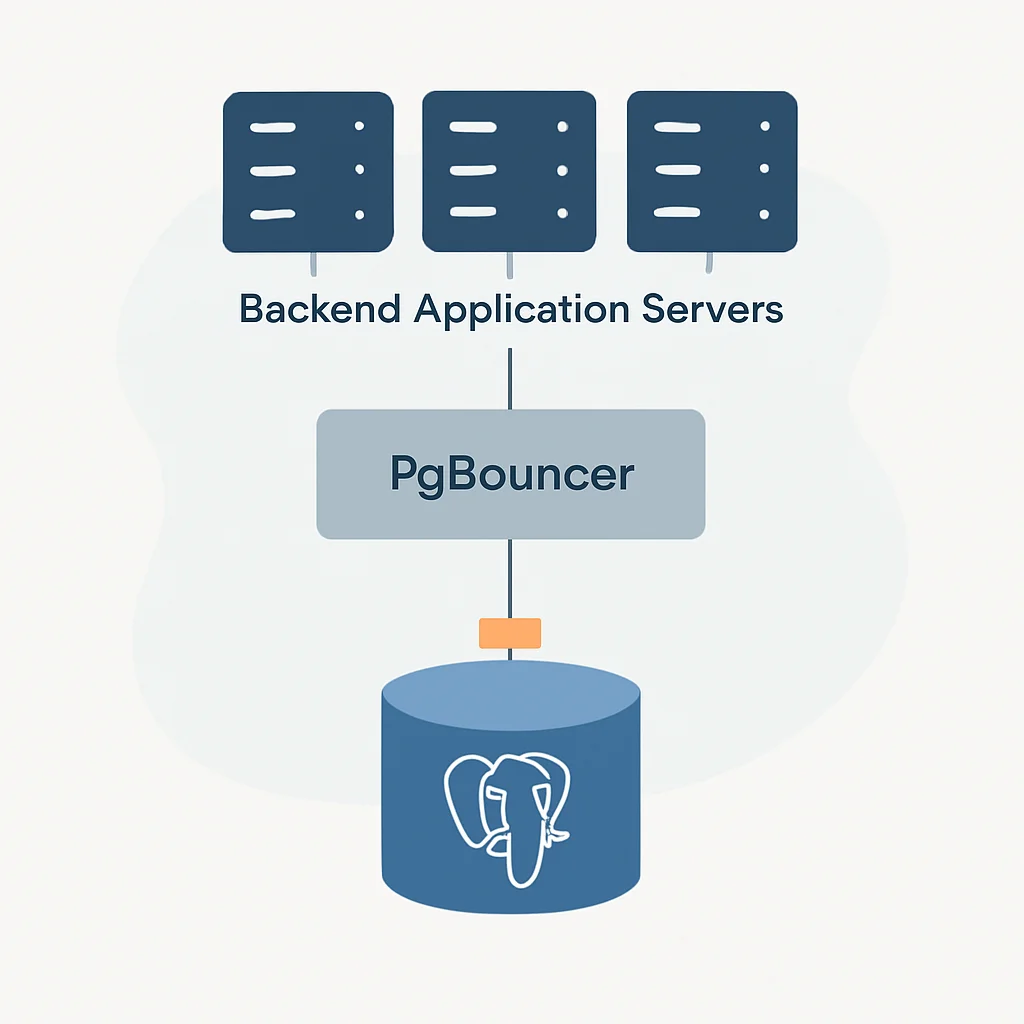
4. Connection Pooling: Bridging Application and Database
Directly opening and closing database connections for every request is a performance killer. Connection pooling is an essential technique for managing database connections efficiently. A connection pooler, like PgBouncer or PgCat, sits between your application and PostgreSQL.
Benefits of Connection Pooling:
- Reduced Overhead: Eliminates the expensive process of establishing new connections for each request.
- Resource Management: Limits the total number of active connections to the database, preventing it from being overwhelmed, even under high application load. This allows you to set a lower
max_connectionson the database server itself. - Improved Throughput: By reusing existing connections, applications can achieve higher transaction rates.
- Failover Support: Some advanced poolers can help manage database failovers more gracefully.
For a typical backend service in 2026, using a connection pooler like PgBouncer is almost mandatory. It can be deployed on the same server as PostgreSQL, on a separate server, or within your application environment. For example, a PgBouncer instance configured with 50-100 server connections can efficiently serve hundreds or thousands of application connections, especially with transaction pooling mode.
PROBLEM SOLVING
Addressing Advanced Scalability Challenges
While tuning and optimization can take you far, eventually, every database hits its limits. Scalability strategies are about preparing for and overcoming these hard limits.
PROBLEM 01
Vertical Scaling Limits: Running out of single-server capacity.
Even the most powerful single server has a finite amount of CPU, RAM, and I/O throughput. When your application grows to a point where a single PostgreSQL instance can no longer handle the load, you face the challenge of scaling horizontally.
SOLUTION — Implement Horizontal Scaling with Partitioning & Sharding
Table Partitioning: PostgreSQL’s declarative partitioning (introduced in version 10, significantly enhanced by 2026) allows you to divide a large table into smaller, more manageable pieces called partitions. This improves query performance by allowing the planner to scan only relevant partitions, and simplifies maintenance tasks like backups and archiving.
Common partitioning strategies include:
- Range Partitioning: Based on a range of values, typically dates or IDs. Ideal for time-series data (e.g., logs, sensor readings).
- List Partitioning: Based on a specific list of values, like regions or user types.
- Hash Partitioning: Distributes data evenly across partitions based on a hash of a column, useful for uniform distribution but harder to query specific ranges.
Sharding: For truly massive scale, sharding takes partitioning a step further by distributing data across multiple independent PostgreSQL instances. Each instance (shard) holds a subset of the total data. This is a complex architectural decision, often requiring application-level logic to determine which shard to query or write to. While PostgreSQL itself doesn’t offer native sharding, tools like Citus Data (now part of Microsoft Azure) provide distributed database capabilities on top of PostgreSQL, transforming it into a distributed SQL database.
CODE EXPLANATION
This code snippet demonstrates declarative range partitioning for a large sensor_data table based on the recorded_at timestamp. We create a master table and then define partitions for specific time ranges, ensuring that new data is automatically routed to the correct partition.
-- Create a partitioned table
CREATE TABLE sensor_data (
    sensor_id INT NOT NULL,
    recorded_at TIMESTAMP WITH TIME ZONE NOT NULL,
    temperature NUMERIC,
    humidity NUMERIC
) PARTITION BY RANGE (recorded_at);

-- Create partitions for specific date ranges
CREATE TABLE sensor_data_2025_q4 PARTITION OF sensor_data
FOR VALUES FROM ('2025-10-01 00:00:00+00') TO ('2026-01-01 00:00:00+00');

CREATE TABLE sensor_data_2026_q1 PARTITION OF sensor_data
FOR VALUES FROM ('2026-01-01 00:00:00+00') TO ('2026-04-01 00:00:00+00');

CREATE TABLE sensor_data_2026_q2 PARTITION OF sensor_data
FOR VALUES FROM ('2026-04-01 00:00:00+00') TO ('2026-07-01 00:00:00+00');

-- Example insert (PostgreSQL automatically routes to correct partition)
INSERT INTO sensor_data (sensor_id, recorded_at, temperature, humidity)
VALUES (101, '2026-02-15 14:30:00+00', 25.5, 60.2);
PROBLEM 02
High Write Workloads & Read-Heavy Applications.
Many modern backend applications are read-heavy, meaning they perform significantly more read operations than write operations. A single primary database can become a bottleneck for reads under high concurrency, while heavy write traffic can also strain its resources.
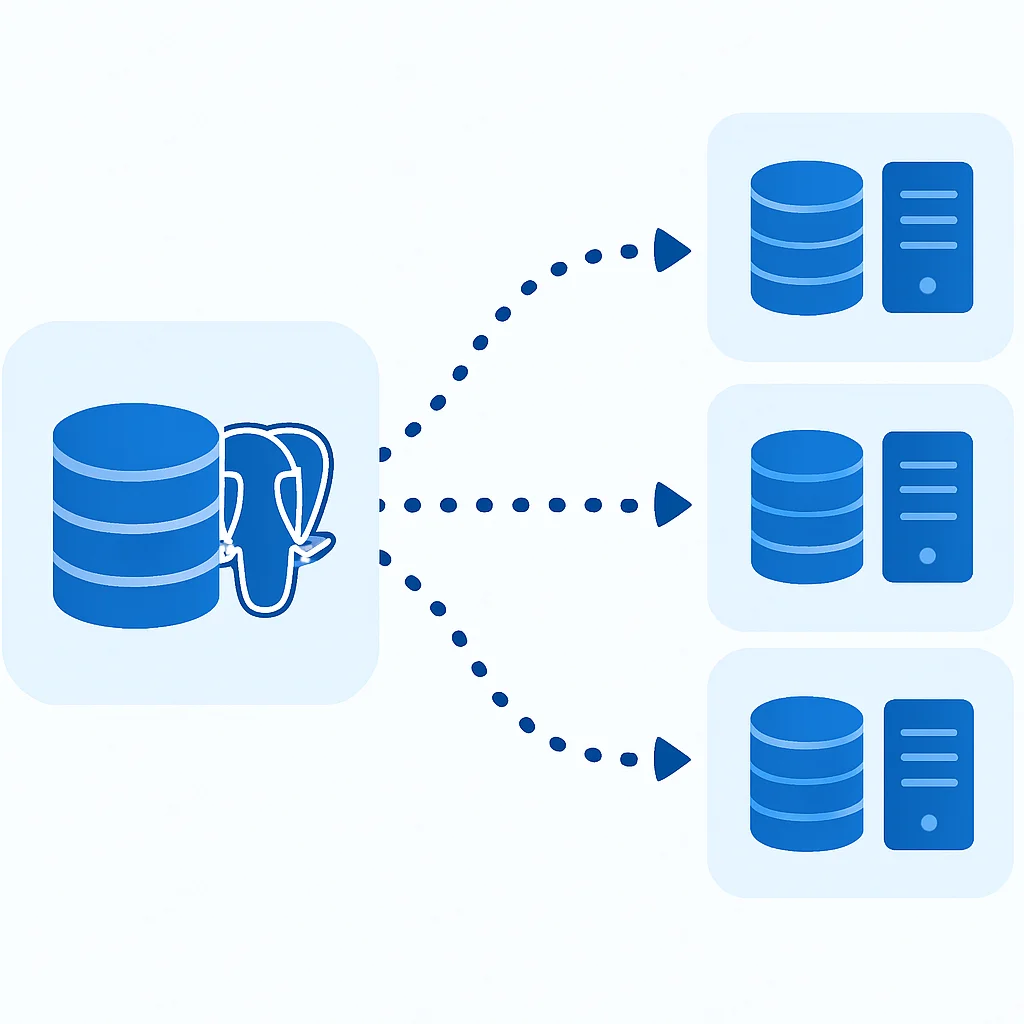
SOLUTION — Leverage Replication for Read Scaling and High Availability
PostgreSQL’s built-in replication mechanisms are powerful tools for both high availability and scaling read workloads. By creating one or more “replica” servers that asynchronously or synchronously mirror the data from a “primary” server, you can distribute read queries across multiple nodes.
Streaming Replication: This is PostgreSQL’s most common and robust replication method. The primary server continuously streams its Write-Ahead Log (WAL) to one or more standby servers. Standbys apply these WAL records to stay up-to-date. This provides:
- Read Scaling: Direct read queries to standby servers, offloading the primary.
- High Availability: If the primary fails, a standby can be promoted to become the new primary, minimizing downtime.
Logical Replication (PostgreSQL 10+): Allows for more granular replication, replicating specific tables or subsets of data. This is useful for migrating data, integrating with other systems, or creating specialized replicas (e.g., a replica for analytical queries with different indexing). It’s also suitable for heterogeneous environments or selective data distribution.
For a typical read-heavy backend, setting up at least one streaming replica is a fundamental step. Application logic or a load balancer can then distribute read traffic between the primary and replicas. For example, a system with a single primary handling 10,000 writes/second can easily serve 50,000-100,000 reads/second by adding 2-3 well-provisioned read replicas.
PROBLEM 03
Long-Running Transactions & Locking Issues.
Long-running transactions can hold locks, blocking other operations and leading to performance degradation. They also prevent VACUUM from cleaning up dead tuples, leading to table bloat and increased disk I/O.
SOLUTION — Optimize Transaction Management and Maintenance
Short Transactions: Design your application to keep transactions as short and concise as possible. Commit frequently. Avoid user interaction or network calls within a transaction if possible.
Proper Indexing for Locks: Ensure that rows being updated or deleted are quickly found using appropriate indexes, minimizing the time row-level locks are held.
Transaction Isolation Levels: Understand and use the appropriate isolation level. READ COMMITTED (default) is usually sufficient, but higher levels like REPEATABLE READ or SERIALIZABLE introduce more locking overhead and potential for transaction retries.
Monitoring Locks: Use pg_stat_activity and pg_locks to identify blocking queries and long-running transactions. Proactively terminate problematic sessions if necessary.
VACUUM and ANALYZE: These maintenance tasks are critical. VACUUM reclaims space occupied by dead tuples, preventing table bloat, while ANALYZE updates statistics for the query planner. Autovacuum usually handles this well, but manual intervention or tuning might be needed for very busy tables. For example, a heavily updated table could benefit from a more aggressive autovacuum setting on that specific table.
KEY POINT
Preventative measures like short transactions and well-tuned autovacuum are far more effective than reacting to lock contention or bloat after they’ve impacted production performance.
PRACTICAL APPLICATION
Best Practices for Backend Developers
Optimizing PostgreSQL isn’t just a DBA’s job; backend developers play a crucial role in writing efficient code and designing effective schemas. Here are some practical tips for 2026.
1. Intelligent Schema Design
The schema is the blueprint of your data. A well-designed schema can preempt many performance issues.
- Normalization vs. Denormalization: While normalization reduces data redundancy and improves data integrity, it often requires more joins, which can impact read performance. Strategic denormalization (e.g., caching frequently joined data in a single table, using materialized views) can boost read speeds for specific use cases, but must be managed carefully to avoid data inconsistencies.
- JSONB for Flexibility: PostgreSQL’s
JSONBdata type is incredibly powerful for flexible schemas, especially for semi-structured data like user preferences or product attributes. It allows for efficient querying with GIN indexes. However, don’t use it as a complete replacement for relational structures; combine it with traditional columns where appropriate. - UUIDs vs. Auto-Incrementing Integers: UUIDs (
gen_random_uuid()) offer global uniqueness and can be beneficial in distributed systems, preventing ID collisions during merges. However, they are larger (16 bytes vs. 4/8 bytes for integers) and can lead to less efficient indexing (due to randomness causing more disk seeks) compared to monotonically increasing integers, especially for primary keys that are also clustered. For high-insert tables, consider UUIDs generated in a time-ordered fashion (e.g., UUIDv7, which is ordered).
2. ORM Usage Best Practices
Object-Relational Mappers (ORMs) like SQLAlchemy (Python), Hibernate (Java), or Prisma (Node.js) simplify database interactions but can hide performance pitfalls if not used judiciously.
- Combat N+1 Queries: Always use eager loading features (e.g.,
.select_related()or.prefetch_related()in Django,.options(joinedload(...))in SQLAlchemy) to fetch related objects in a single query. - Batch Operations: When inserting or updating many rows, use your ORM’s bulk insert/update capabilities. Instead of N individual
INSERTstatements, perform a singleINSERT ... VALUES (...), (...), (...)statement. - Know When to Use Raw SQL: For highly complex reports, analytical queries, or performance-critical operations where the ORM generates inefficient SQL, don’t hesitate to drop down to raw SQL. Most ORMs provide mechanisms to execute raw queries.
KEY POINT
Treat ORMs as powerful tools, not magic solutions. Always profile the SQL they generate, especially for critical paths, to ensure efficiency.
3. Comprehensive Monitoring & Alerting
You can’t optimize what you don’t measure. Robust monitoring is essential for identifying performance trends, detecting issues early, and validating optimization efforts.
- PostgreSQL Statistics Views:
pg_stat_statements: Tracks execution statistics for all queries executed by the server. Invaluable for finding slow queries.pg_stat_activity: Shows current activity in the database, including running queries, their states, and which ones are waiting on locks.pg_stat_user_tables/pg_stat_user_indexes: Provide statistics on table and index usage, helping identify bloated tables or unused indexes.
- External Monitoring Tools: Integrate with tools like Prometheus/Grafana, Datadog, New Relic, or AWS CloudWatch (for RDS) to collect and visualize key metrics (CPU, RAM, disk I/O, connection count, query latency). Set up alerts for deviations from baselines.
- Logging: Configure PostgreSQL logging to capture slow queries (
log_min_duration_statement).
WARNING
Neglecting database monitoring is like driving blindfolded. Without it, you’ll only discover performance issues when your users report them, which is often too late.
FAQ
Frequently Asked Questions
Q. Why choose PostgreSQL over other databases in 2026?
PostgreSQL’s robust feature set, strong adherence to SQL standards, extensibility, and open-source nature make it a highly reliable and future-proof choice. It excels in handling complex queries, diverse data types (like JSONB), and offers excellent scalability options, making it suitable for a wide range of applications from transactional systems to data warehousing.
Q. How often should I run VACUUM ANALYZE?
For most setups, PostgreSQL’s autovacuum daemon handles this automatically and efficiently. You should primarily rely on autovacuum. However, for very high-transaction tables that experience significant updates or deletes, you might need to tune autovacuum parameters for those specific tables or consider manual VACUUM FULL operations during maintenance windows if bloat becomes an issue.
Q. What is the most common performance bottleneck in PostgreSQL?
Inefficient queries, often due to missing or inappropriate indexes, are the most frequent performance bottlenecks. Other common issues include poorly configured shared_buffers or work_mem settings, lack of connection pooling, and table bloat from insufficient VACUUM operations.
Q. Can PostgreSQL handle millions of users?
Absolutely. With proper architecture, optimization, and scaling strategies (like replication, partitioning, and sharding), PostgreSQL can comfortably support applications with millions of active users and petabytes of data. Large companies and critical systems globally rely on PostgreSQL for their high-traffic applications.
Q. What’s the role of connection pooling?
Connection pooling is crucial for performance and resource management. It reuses existing database connections instead of opening a new one for every request, drastically reducing overhead. It also limits the total number of connections to the database, preventing it from being overloaded under high application traffic and improving overall throughput.
WRAP-UP
Conclusion & Future Outlook
Mastering PostgreSQL for backend development in 2026 is an ongoing journey that demands continuous learning and adaptation. From meticulously crafting your indexes and queries to fine-tuning server configurations and embracing horizontal scaling, every decision impacts the performance and resilience of your application.
The techniques discussed in this report—strategic indexing, query optimization with EXPLAIN ANALYZE, intelligent postgresql.conf tuning, indispensable connection pooling, and advanced scalability patterns like partitioning and replication—form the bedrock of high-performance PostgreSQL deployments. By integrating these practices into your development workflow, you empower your backend systems to handle increasing loads and deliver exceptional user experiences.
Looking ahead, PostgreSQL’s ecosystem is only growing stronger. Expect further enhancements in native sharding capabilities, more advanced indexing types, and continued improvements in performance and concurrency. The community’s dedication to innovation ensures that PostgreSQL will remain a dominant force in the backend database world for years to come. Your investment in mastering its intricacies today will pay dividends in the scalable, robust applications of tomorrow.
Thanks for reading!
We hope this deep dive into PostgreSQL optimization helps you build faster, more scalable backend applications.
Got questions or your own favorite PostgreSQL tips? Drop a comment below!