
SUMMARY
Centralized Logging with Loki & Grafana: A Developer’s Guide in 2026
Streamline your cloud-native application logging with Loki and Grafana for powerful, cost-effective observability in 2026.
Keywords: Loki, Grafana, Cloud-Native Logging
TABLE OF CONTENTS
1. Introduction: The Imperative for Centralized Logging
2. Loki & Grafana: A Modern Logging Paradigm
3. Comparative Analysis: Loki vs. Traditional Solutions
4. Overcoming Implementation Challenges
5. Practical Setup: Loki, Promtail, and Grafana
6. Optimizing Log Analysis with Grafana Dashboards
7. Frequently Asked Questions
8. Conclusion: The Future of Observability
INTRODUCTION
The Imperative for Centralized Logging
In the rapidly evolving landscape of cloud-native applications and microservices, effective logging is no longer just a nice-to-have; it’s a critical component of any robust observability strategy. As we navigate 2026, applications are increasingly distributed, dynamic, and complex, making traditional logging approaches—like SSHing into individual servers to tail -f log files—utterly impractical and inefficient. Imagine debugging an issue across dozens, or even hundreds, of ephemeral containers spread across multiple cloud regions. Without a centralized logging solution, this becomes a developer’s worst nightmare.
The sheer volume of log data generated by modern applications can be staggering. A medium-sized microservices architecture, for instance, can easily generate gigabytes to terabytes of log data daily. Managing this data effectively is crucial for several reasons:
✓ Faster Troubleshooting: Quickly pinpoint errors, exceptions, and anomalies across all services.
✓ Improved Security Posture: Detect suspicious activities or unauthorized access by correlating security-related logs.
✓ Performance Optimization: Identify bottlenecks and performance regressions by analyzing request latencies and resource usage logs.
✓ Compliance & Auditing: Maintain an immutable record of system activities for regulatory compliance.
This is where the powerful combination of Loki and Grafana enters the scene. Grafana Loki is a horizontally scalable, highly available, multi-tenant log aggregation system inspired by Prometheus. It’s designed to be incredibly cost-effective and easy to operate. When paired with Grafana for visualization and analysis, it provides a comprehensive, modern logging solution tailored for the demands of 2026’s distributed systems.
KEY POINT
Centralized logging is indispensable for modern cloud-native applications in 2026, enabling faster debugging, enhanced security, performance optimization, and compliance across distributed systems.
CORE CONTENT
Loki & Grafana: A Modern Logging Paradigm
Grafana Loki distinguishes itself from other logging systems by adopting a unique, “index-less” approach. Instead of indexing the entire log content, Loki indexes only metadata about the logs, known as labels. This design choice is inspired by how Prometheus handles metrics, leading to significant cost savings and operational simplicity.
How Loki Works: Logs Like Prometheus
At its core, Loki consists of three main components:
1. Promtail: This is the agent responsible for collecting logs from various sources (e.g., files, Docker containers, Kubernetes pods) and sending them to Loki. Promtail discovers log files, attaches relevant labels (like app=frontend, namespace=production), and streams them to the Loki server.
2. Loki (Server): The central component that receives log streams from Promtail, indexes their labels, and stores the raw log data in object storage (like AWS S3, Google Cloud Storage, or MinIO). The index is much smaller because it only contains labels, not the full log lines, making queries incredibly fast when filtering by labels.
3. Grafana: The visualization layer. Grafana acts as the user interface where developers and operators can explore, query, and visualize logs stored in Loki using its powerful query language, LogQL. Grafana can also combine logs with metrics from Prometheus for a unified observability experience.
This architecture significantly reduces storage requirements and operational overhead compared to full-text indexing solutions. You query logs by filtering on labels first, then applying regex or text search on the filtered log streams. This “grep-able” approach makes Loki incredibly efficient for targeted log analysis.
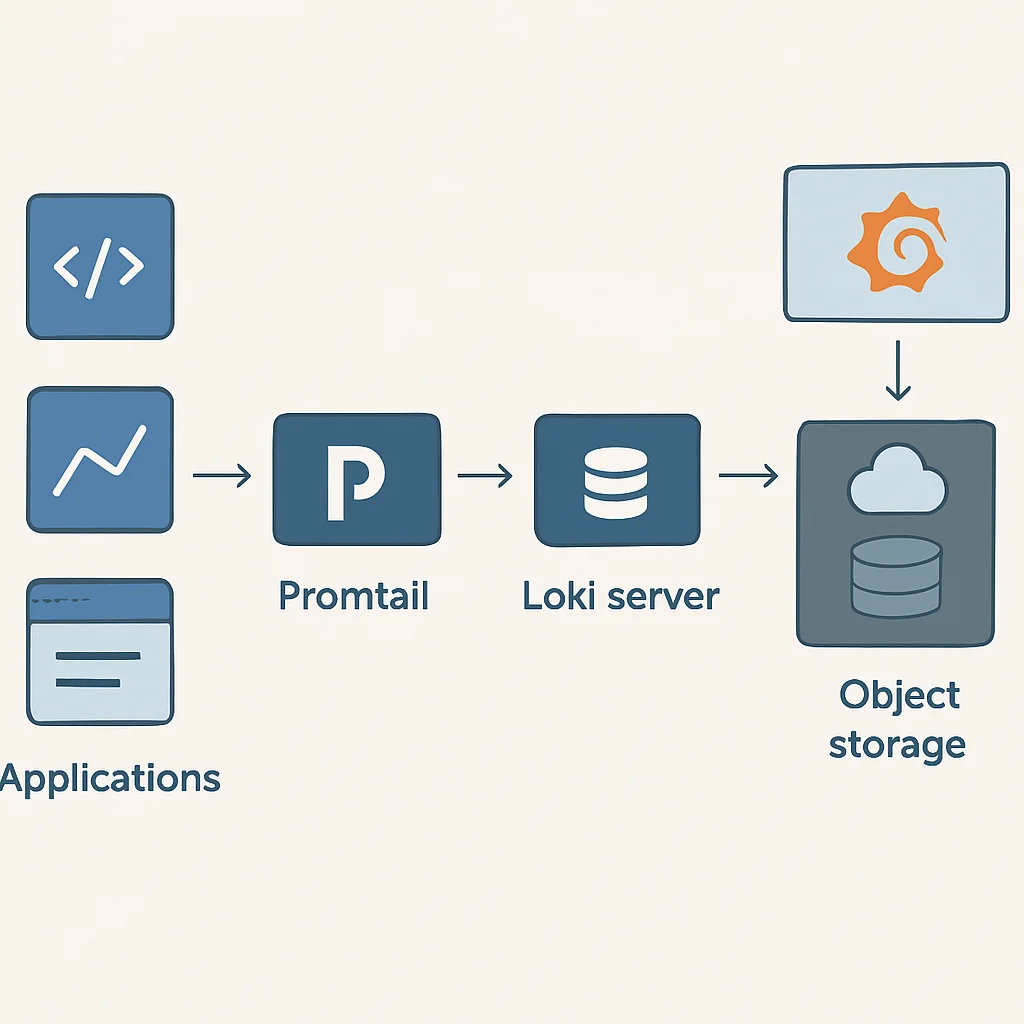
The diagram above illustrates how Promtail acts as the bridge, collecting logs from your applications and enriching them with labels before sending them to the Loki server. Loki, in turn, stores these labeled log streams efficiently, ready for Grafana to query and display.
KEY POINT
Loki’s “index-less” design, where only metadata (labels) are indexed, drastically reduces storage costs and improves query performance for targeted log analysis, making it ideal for cloud-native environments in 2026.
COMPARATIVE ANALYSIS
Loki vs. Traditional Solutions
To truly appreciate Loki’s advantages, it’s helpful to compare it with established logging solutions like the ELK Stack (Elasticsearch, Logstash, Kibana) and Splunk. While these tools are powerful, they come with their own set of trade-offs, particularly concerning cost, complexity, and resource consumption.
ELK Stack (Elasticsearch, Logstash, Kibana)
The ELK Stack has been the de facto standard for centralized logging for years. Elasticsearch provides powerful full-text search capabilities, Logstash handles log processing and ingestion, and Kibana offers rich visualization. However, its strengths also lead to its weaknesses in a cloud-native context:
Pros
✓ Robust full-text search and complex aggregations.
✓ Mature ecosystem with extensive integrations.
Cons
✗ High resource consumption due to full-text indexing. Elasticsearch nodes require significant CPU, RAM, and fast storage.
✗ Complex to scale and operate, especially for large data volumes. Managing shards, replicas, and cluster health can be challenging.
✗ Higher operational costs, both for infrastructure and management. A production ELK cluster handling 1TB of logs daily could easily cost several thousand dollars per month in cloud resources alone in 2026.
Splunk
Splunk is an enterprise-grade solution known for its powerful search, analysis, and visualization capabilities across machine data. It’s often used in large organizations with complex needs, but it comes with a premium price tag.
Pros
✓ Industry-leading features for security, operations, and business intelligence.
✓ Excellent support and comprehensive documentation.
Cons
✗ Extremely high licensing costs, often prohibitive for smaller or even medium-sized companies.
✗ Proprietary solution, leading to vendor lock-in.
Loki & Grafana
Loki and Grafana offer a compelling alternative, especially for organizations embracing cloud-native principles and looking for a cost-efficient, operationally simple logging solution.
Pros
✓ Significantly lower storage costs: Only indexes metadata, not full log lines. This can result in 5-10x cost reduction compared to full-text indexing solutions.
✓ Reduced operational overhead: Simpler architecture, easier to deploy and manage.
✓ Seamless integration with Prometheus & Grafana: A unified observability stack for metrics and logs.
✓ Cloud-native friendly: Designed for Kubernetes and object storage.
Cons
✗ Less powerful full-text search: Requires filtering by labels first, then text search on streams.
✗ Heavy reliance on good label design: Poorly chosen labels can impact query performance.
Here’s a quick comparison table summarizing the key differences:
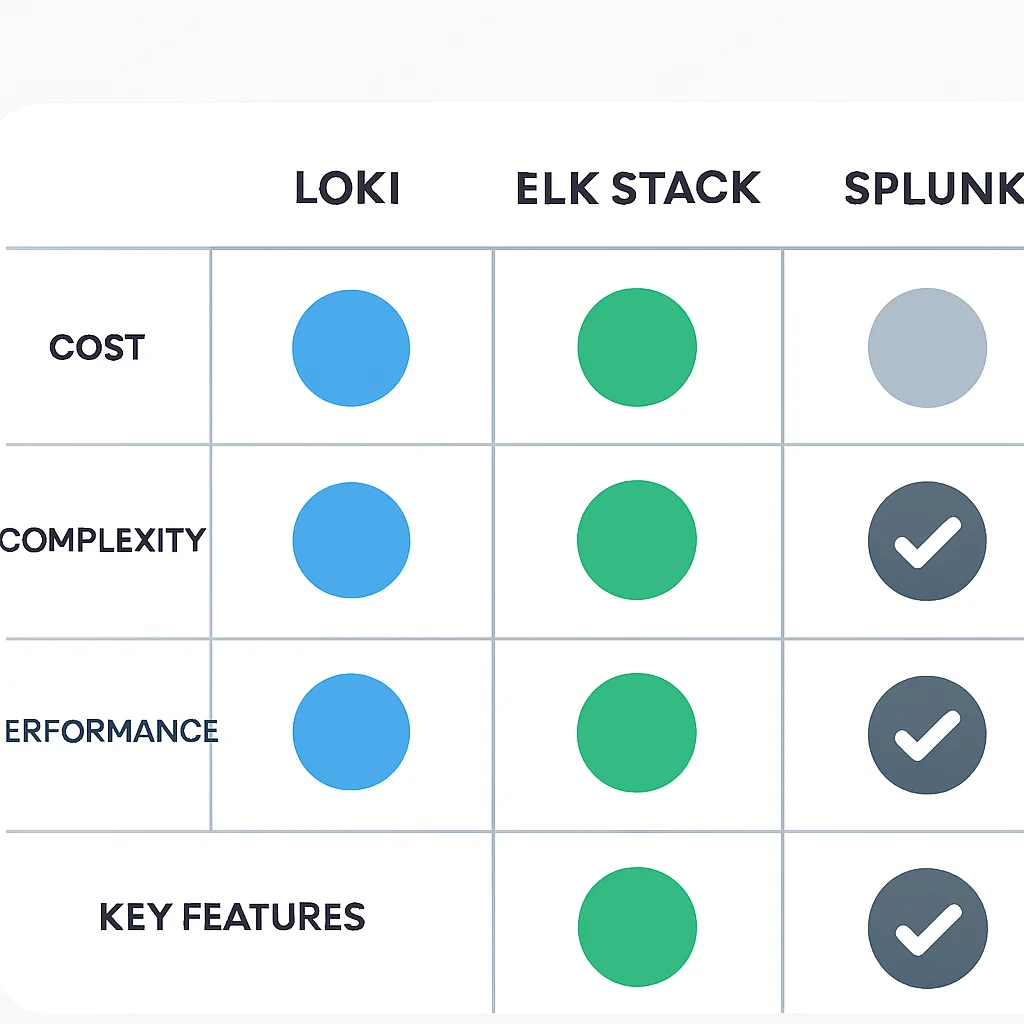
Comparison Table: Centralized Logging Solutions (2026)
For many cloud-native setups in 2026, Loki’s balance of cost-efficiency, operational simplicity, and tight integration with the Grafana ecosystem makes it a highly attractive choice, especially when you already use Prometheus for metrics. It allows developers to get the necessary insights without the heavy resource footprint and management overhead of traditional solutions.
KEY POINT
Loki offers a compelling Total Cost of Ownership (TCO) advantage, often reducing logging infrastructure costs by 5x-10x compared to solutions like the ELK Stack, by foregoing full-text indexing in favor of label-based metadata.
PROBLEM SOLVING
Overcoming Implementation Challenges
While Loki and Grafana offer a streamlined logging experience, setting them up and maintaining them in a production environment can present some common challenges. Being aware of these and knowing their solutions is key to a smooth implementation.
Promtail Configuration Errors: Logs Not Being Scraped
You’ve deployed Promtail, but no logs are appearing in Loki or Grafana. This is often due to incorrect Promtail configuration, especially issues with scrape_configs or relabel_configs.
SOLUTION — Validate Promtail’s Configuration & Logs
First, ensure your promtail-config.yaml is syntactically correct. Promtail itself generates logs about its scraping activities. Check Promtail’s own logs for errors related to file discovery or connection to Loki. Use the promtail --config.file=/etc/promtail/promtail-config.yaml --dry-run command to validate the configuration before deployment.
CODE EXPLANATION
This Promtail configuration snippet demonstrates how to scrape Docker container logs, extracting the container name and ID as labels. The __path__ specifies the log file location, and relabel_configs are used to extract and rename labels.
server:
  http_listen_port: 9080
  grpc_listen_port: 0

positions:
  filename: /tmp/positions.yaml

clients:
  - url: http://loki:3100/loki/api/v1/push

scrape_configs:
  - job_name: docker
    docker_sd_configs:
      - host: unix:///var/run/docker.sock
        refresh_interval: 5s
    relabel_configs:
      - source_labels: ['__meta_docker_container_name']
        regex: '/(.*)'
        target_label: 'container'
      - source_labels: ['__meta_docker_container_id']
        target_label: 'container_id'
      - source_labels: ['__meta_docker_image_name']
        target_label: 'image'
      - source_labels: ['__meta_docker_container_label_com_docker_compose_service']
        target_label: 'service'
        action: replace
        regex: '(.+)'
      - source_labels: ['__meta_docker_log_stream']
        target_label: 'log_stream'
      - replacement: /var/lib/docker/containers/${__meta_docker_container_id}/$${__meta_docker_container_id}-json.log
        target_label: __path__
        action: replace
High Cardinality Labels Leading to Performance Degradation
Loki’s performance is heavily dependent on efficient label usage. If you assign labels with unique values for every log line (e.g., a unique request ID, timestamp, or a highly dynamic path), you’re creating “high cardinality” labels. This can bloat Loki’s index, slow down queries, and increase storage costs, essentially negating Loki’s primary advantage.
SOLUTION — Careful Label Design & Relabeling
The key is to use labels for attributes that have a limited and predictable set of values (e.g., service name, environment, log level, host). Avoid using values that change with every log entry. For highly dynamic data like request IDs, log these within the log line itself, and extract them during query time using LogQL’s parsing capabilities (e.g., json, logfmt, or regex parsers). Use Promtail’s relabel_configs to drop or generalize high-cardinality labels before they reach Loki.
CODE EXPLANATION
This relabel_config example demonstrates dropping a label named unique_request_id if it has high cardinality. The action: drop effectively prevents it from being indexed by Loki.
      - source_labels: ['__meta_kubernetes_pod_label_unique_request_id'] # Example of a high-cardinality label
        action: drop # Drop this label to prevent index bloat
KEY POINT
The most critical factor for Loki’s performance and cost-efficiency is judicious label selection. Avoid high-cardinality labels by logging dynamic information within the log line and using LogQL for parsing, rather than indexing it directly.
PRACTICAL APPLICATION
Practical Setup: Loki, Promtail, and Grafana
Let’s get our hands dirty and set up a basic Loki, Promtail, and Grafana stack using Docker Compose. This setup is perfect for local development, testing, or small-scale deployments. For production, especially in Kubernetes, you’d typically use Helm charts.
Prerequisites
Ensure you have Docker and Docker Compose installed on your system. You can download them from the official Docker website.
Step 1: Create docker-compose.yaml
Create a file named docker-compose.yaml with the following content. This file defines services for Loki, Promtail, and Grafana, along with their configurations and dependencies.
CODE EXPLANATION
This Docker Compose file sets up Loki, Promtail, and Grafana. Loki exposes port 3100 for Promtail to push logs. Promtail mounts the Docker socket to discover and scrape container logs, and it’s configured via /etc/promtail/config.yaml. Grafana runs on port 3000 and is pre-configured with the Loki data source.
version: "3.8"

networks:
  loki-network:

volumes:
  grafana-data:
  loki-data:

services:
  loki:
    image: grafana/loki:2.9.2
    container_name: loki
    ports:
      - "3100:3100"
    command: -config.file=/etc/loki/local-config.yaml
    volumes:
      - ./loki-config.yaml:/etc/loki/local-config.yaml
      - loki-data:/loki
    networks:
      - loki-network
    restart: unless-stopped

  promtail:
    image: grafana/promtail:2.9.2
    container_name: promtail
    volumes:
      - /var/log:/var/log
      - /var/lib/docker/containers:/var/lib/docker/containers:ro
      - ./promtail-config.yaml:/etc/promtail/config.yaml
      - /var/run/docker.sock:/var/run/docker.sock
    command: -config.file=/etc/promtail/config.yaml
    networks:
      - loki-network
    depends_on:
      - loki
    restart: unless-stopped

  grafana:
    image: grafana/grafana:10.4.2
    container_name: grafana
    ports:
      - "3000:3000"
    volumes:
      - grafana-data:/var/lib/grafana
      - ./grafana-datasources.yaml:/etc/grafana/provisioning/datasources/datasources.yaml
    environment:
      - GF_SECURITY_ADMIN_USER=admin
      - GF_SECURITY_ADMIN_PASSWORD=admin
    networks:
      - loki-network
    depends_on:
      - loki
    restart: unless-stopped
Step 2: Create Loki Configuration (loki-config.yaml)
This minimal configuration tells Loki where to store its index and chunks. For a simple setup, we’ll use the filesystem.
CODE EXPLANATION
This basic Loki configuration uses the filesystem for both index and chunk storage, suitable for local development. For production, consider object storage (S3, GCS) for scalability and durability.
auth_enabled: false

server:
  http_listen_port: 3100

common:
  path_prefix: /loki
  storage_config:
    boltdb_shipper:
      active_index_directory: /loki/boltdb-shipper-active
      cache_location: /loki/boltdb-shipper-cache
      resync_interval: 5s
    filesystem:
      directory: /loki/chunks
  replication_factor: 1
  ring:
    kvstore:
      store: inmemory

schema_config:
  configs:
    - from: 2020-10-27
      store: boltdb-shipper
      object_store: filesystem
      schema: v11
      period: 24h

compactor:
  working_directory: /loki/compactor
  shared_store: filesystem
Step 3: Create Promtail Configuration (promtail-config.yaml)
This configuration tells Promtail to scrape logs from all running Docker containers and send them to our Loki instance.
CODE EXPLANATION
This Promtail configuration is designed to scrape logs from all Docker containers. It extracts container name, ID, image, and service (if using Docker Compose) as labels. The clients section points to the Loki server’s endpoint.
server:
  http_listen_port: 9080
  grpc_listen_port: 0

positions:
  filename: /tmp/positions.yaml

clients:
  - url: http://loki:3100/loki/api/v1/push

scrape_configs:
  - job_name: docker
    docker_sd_configs:
      - host: unix:///var/run/docker.sock
        refresh_interval: 5s
    relabel_configs:
      - source_labels: ['__meta_docker_container_name']
        regex: '/(.*)'
        target_label: 'container'
      - source_labels: ['__meta_docker_container_id']
        target_label: 'container_id'
      - source_labels: ['__meta_docker_image_name']
        target_label: 'image'
      - source_labels: ['__meta_docker_container_label_com_docker_compose_service']
        target_label: 'service'
        action: replace
        regex: '(.+)'
      - source_labels: ['__meta_docker_log_stream']
        target_label: 'log_stream'
      - replacement: /var/lib/docker/containers/${__meta_docker_container_id}/${__meta_docker_container_id}-json.log
        target_label: __path__
        action: replace
Step 4: Configure Grafana Data Source (grafana-datasources.yaml)
This file pre-provisions a Loki data source in Grafana, so you don’t have to add it manually.
CODE EXPLANATION
This YAML configures Grafana to automatically add Loki as a data source upon startup. It specifies the type as loki and points to the Loki service within the Docker network.
apiVersion: 1

datasources:
  - name: Loki
    type: loki
    access: proxy
    orgId: 1
    url: http://loki:3100
    basicAuth: false
    isDefault: true
    version: 1
    editable: false
    jsonData:
      maxLines: 1000
Step 5: Start the Stack
Navigate to the directory containing your docker-compose.yaml, loki-config.yaml, promtail-config.yaml, and grafana-datasources.yaml files and run:
CODE EXPLANATION
This command starts all services defined in your docker-compose.yaml in detached mode (-d), allowing them to run in the background.
docker-compose up -d
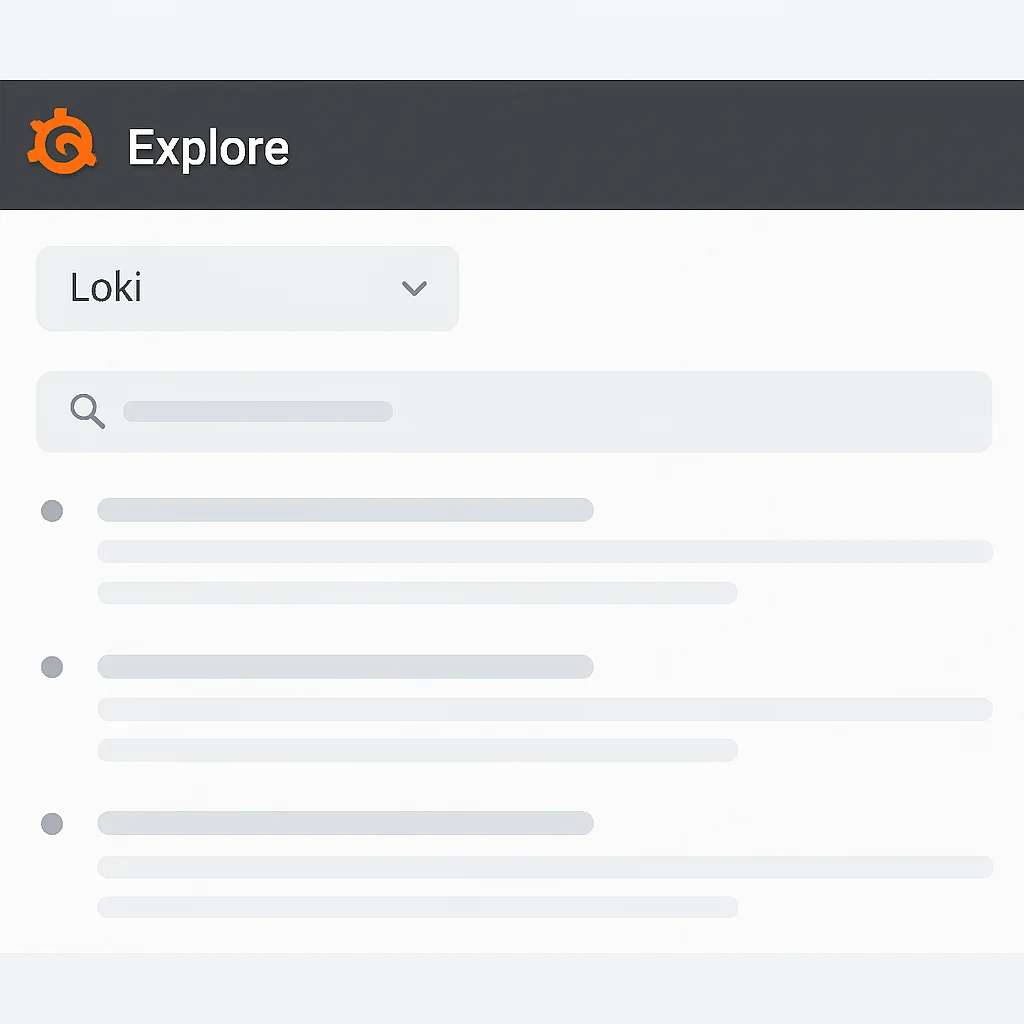
Step 6: Access Grafana and Explore Logs
Open your web browser and go to http://localhost:3000. Log in with username admin and password admin.
Once logged in, navigate to the “Explore” section (usually the compass icon on the left sidebar). Select “Loki” from the data source dropdown. You should now see the LogQL query editor. Try a simple query to see all logs:
CODE EXPLANATION
This LogQL query selects all log streams that have the container="loki" label, effectively showing logs from your Loki container itself. You can replace loki with any other container name that Promtail is scraping.
{container="loki"}
You can also use the “Log browser” in Grafana to easily discover available labels and their values, then build your queries visually. For instance, to see logs from your grafana container, you would use: {container="grafana"}. To search for specific text within those logs, append a filter: {container="grafana"} |= "error".
Optimizing Log Analysis with Grafana Dashboards
Beyond simple exploration, Grafana excels at creating powerful dashboards. You can visualize log trends, error rates, and specific log patterns over time. Here are some ideas for dashboard panels:
☑ Log Volume Over Time: Use sum by(level) (count_over_time({job="my-app"}[5m])) to show log counts per log level (info, warn, error).
☑ Error Rate: Calculate the percentage of error logs: sum(count_over_time({job="my-app", level="error"}[1m])) / sum(count_over_time({job="my-app"}[1m])) * 100.
☑ Top Error Messages: Use topk(5, count_over_time({job="my-app", level="error"} | logfmt | __error__ != "" [1h])) to find the most frequent errors (assuming logfmt parsing).
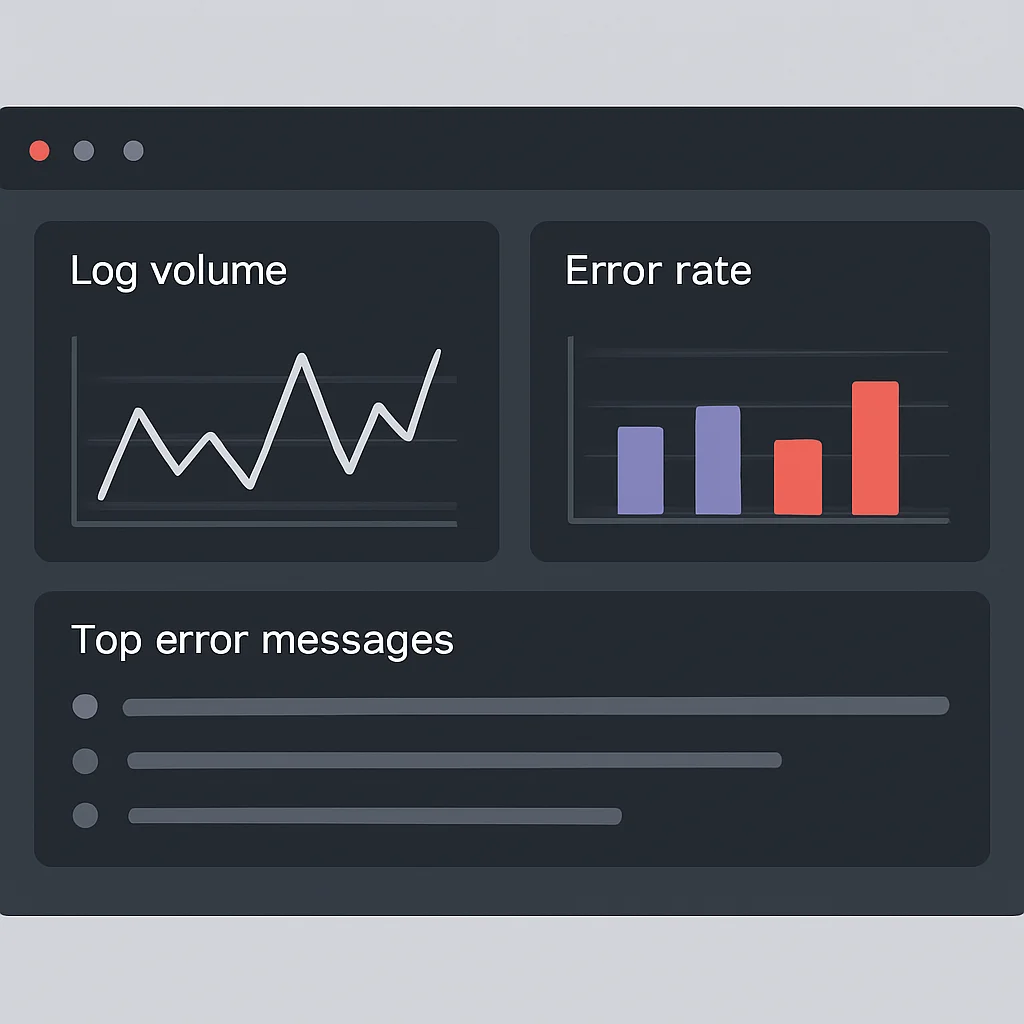
This kind of dashboard provides immediate insights into the health and behavior of your applications, allowing for proactive monitoring and rapid response to issues. The integration with Prometheus metrics in the same Grafana dashboard further enhances your observability capabilities, providing a correlated view of system performance and log events.
KEY POINT
Leveraging Docker Compose provides a quick, portable way to set up a Loki-Grafana stack for development. In production, consider Kubernetes deployments with Helm charts for robust scaling and management. Grafana dashboards are crucial for transforming raw log data into actionable insights.
FAQ
Frequently Asked Questions
Q. What is the main difference between Loki and Elasticsearch for logging?
The primary difference is in their indexing strategy. Elasticsearch performs full-text indexing on all log content, offering powerful search but consuming significant resources. Loki, on the other hand, only indexes metadata (labels), drastically reducing storage and operational costs, but requiring label-based filtering before text search.
Q. Can Loki replace my existing ELK stack entirely?
For many cloud-native use cases focused on operational logs, Loki can be a full replacement, especially if cost and operational simplicity are high priorities. However, if your workflow heavily relies on complex full-text search aggregations or machine learning capabilities directly on logs, an ELK stack might still be more suitable.
Q. How do I ensure my logs are secure with Loki and Grafana?
Security best practices include enabling authentication and authorization for Grafana (e.g., LDAP, OAuth), configuring TLS/SSL for all communications (Promtail to Loki, Grafana to Loki), and implementing robust network policies to restrict access to Loki’s API. Also, ensure your underlying object storage for Loki chunks is properly secured with access controls.
Q. What are the best practices for defining labels in Loki?
Keep labels low-cardinality, meaning they should have a limited set of possible values (e.g., service, environment, level). Avoid labels that are unique per log entry, like timestamps or request IDs, as these will bloat the index and degrade performance. Dynamic data should be part of the log message itself, parsed at query time.
Q. How scalable is Loki for large-scale applications?
Loki is designed for horizontal scalability, leveraging object storage for its log data. It can handle significant log volumes, with deployments processing tens of terabytes per day. Its microservices architecture (distributor, ingester, querier, compactors) allows for independent scaling of components to meet demand, making it suitable for large-scale cloud-native environments in 2026.
WRAP-UP
Conclusion: The Future of Observability
Centralized logging with Loki and Grafana represents a significant evolution in how developers and operations teams approach observability in 2026. By embracing a “logs like Prometheus” philosophy, Loki offers a powerful, cost-effective, and operationally simple solution that aligns perfectly with the demands of modern cloud-native and microservices architectures. Its ability to integrate seamlessly with Grafana for visualization and Prometheus for metrics creates a truly unified observability stack, providing a holistic view of your systems.
The benefits are clear: substantially reduced storage costs (often 5-10x compared to full-text indexing solutions), lower operational overhead, and faster insights into application behavior. While it requires a thoughtful approach to label design, the trade-off is well worth it for the efficiency gained.
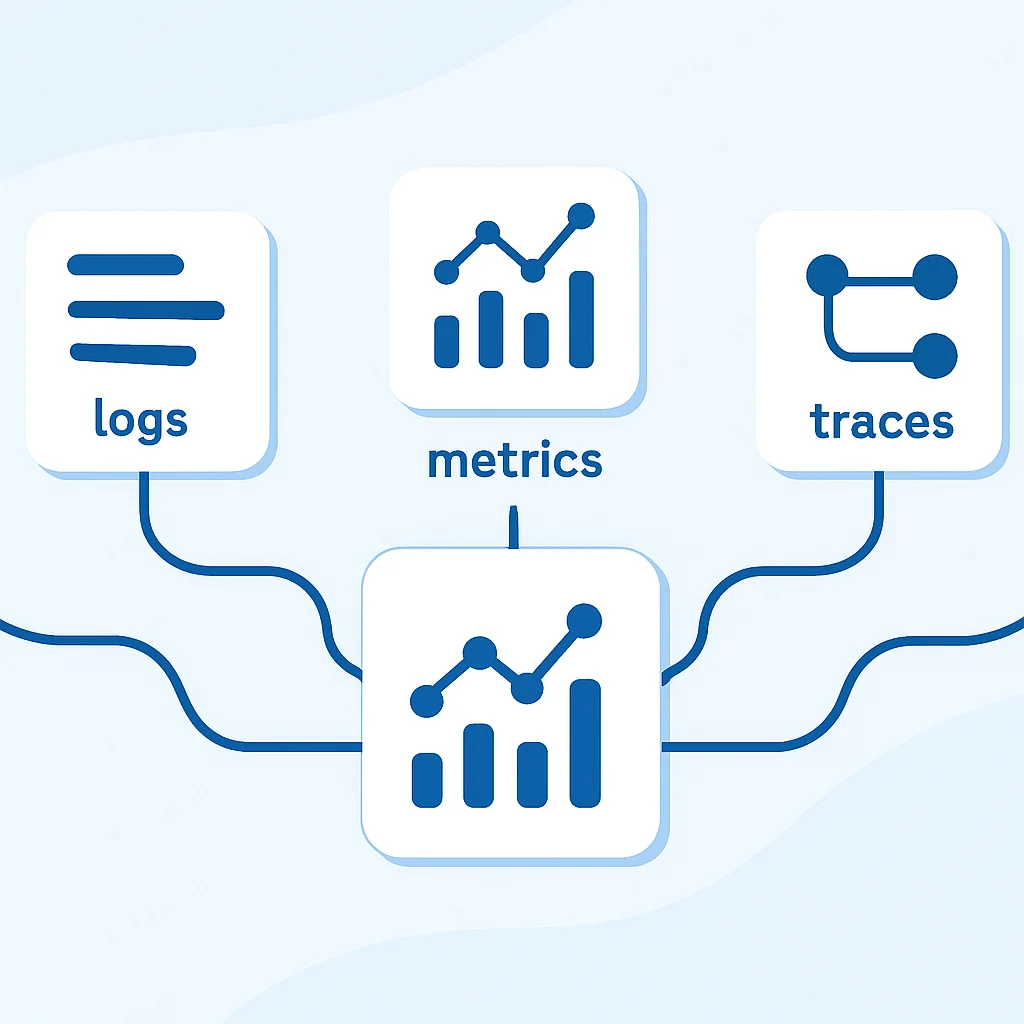
Looking ahead, the landscape of observability will continue to evolve. We can expect even tighter integration between logs, metrics, and traces (the “three pillars of observability”), potentially with more sophisticated AI/ML-driven anomaly detection and predictive analytics built directly into logging platforms. However, the fundamental principles of efficient log collection and intelligent querying, championed by Loki, will remain vital.
If you’re managing distributed applications and grappling with log management challenges, now is the time to explore Loki and Grafana. Start with a simple Docker Compose setup, experiment with Promtail configurations, and build your first Grafana dashboards. You’ll soon discover how this powerful duo can transform your debugging, monitoring, and overall operational efficiency.
KEY POINT
Loki and Grafana deliver a cost-effective, operationally simple, and powerful logging solution for 2026’s cloud-native applications, seamlessly integrating with metrics for a comprehensive observability stack.
Thanks for reading!
We hope this guide helps you in your journey towards more efficient and insightful centralized logging.
Got questions or your own Loki/Grafana tips? Drop a comment below and share your experiences!