
SUMMARY
Demystifying Black Box Models: A Developer’s Guide to Explainable AI (XAI) in 2026
Understand how your machine learning models make decisions and build trust in your AI applications.
Keywords: Explainable AI, XAI, AI Transparency
TABLE OF CONTENTS
1 Introduction: Why Explainable AI Matters in 2026
2 Unpacking the Black Box: Core XAI Techniques
3 Navigating XAI Challenges: Solutions for Developers
4 Practical XAI: Integrating Interpretability into Your Workflow
5 Frequently Asked Questions About XAI
6 Conclusion: The Future of Transparent AI
INTRODUCTION
Why Explainable AI Matters in 2026
Welcome back to Kwonglish! In the rapidly evolving landscape of artificial intelligence, 2026 marks a pivotal year where the demand for transparency and accountability in AI systems is not just a theoretical discussion but a practical necessity. As developers, we’ve grown accustomed to building powerful machine learning models that can predict outcomes with impressive accuracy. However, a common challenge persists: understanding why a model made a particular decision. This is the “black box” problem, and it’s where Explainable AI, or XAI, steps in.
XAI isn’t just a buzzword; it’s a critical field that empowers us to interpret, understand, and debug our AI models. Imagine a medical diagnosis AI that recommends a treatment — without XAI, you’d have no idea if it’s based on relevant symptoms or a spurious correlation. Or consider a loan application system that denies a request; XAI can reveal whether the decision was fair, or if it inadvertently discriminated based on sensitive attributes. In 2026, with increasing regulatory scrutiny (like the EU’s AI Act gaining traction) and public demand for ethical AI, XAI has become an indispensable tool in every developer’s toolkit.
“The era of blindly trusting black-box AI models is rapidly coming to an end. Transparency is no longer optional; it’s foundational for responsible AI development.”
— Kwonglish AI Analyst, 2026
The importance of XAI extends beyond mere compliance. It fosters trust among users, stakeholders, and regulators. When an AI system can articulate its reasoning, even if simplified, it builds confidence. Furthermore, XAI is invaluable for debugging. If your model isn’t performing as expected, XAI techniques can pinpoint which features are driving incorrect predictions, helping you refine your data, features, or model architecture more effectively. It transforms AI development from a trial-and-error process into a more systematic, data-driven methodology.
KEY POINT
In 2026, Explainable AI (XAI) is crucial for regulatory compliance, building user trust, and enabling effective debugging of complex machine learning models, moving beyond the “black box” problem.
This guide will equip you with the knowledge and practical techniques to demystify black-box models. We’ll explore various XAI methods, understand their strengths and limitations, and learn how to integrate them into your development workflow. By the end, you’ll be better prepared to build not just accurate, but also transparent, ethical, and trustworthy AI applications.

CORE CONTENT
Unpacking the Black Box: Core XAI Techniques
At the heart of XAI lies the challenge of interpreting models that, by design, are incredibly complex. Deep neural networks, gradient boosting machines, and ensemble methods often achieve superior performance, but their internal workings are difficult for humans to grasp directly. This section will break down the primary categories of XAI techniques, distinguishing between local and global interpretability, and model-specific versus model-agnostic approaches.
Local Interpretability: Explaining Individual Predictions
Local interpretability focuses on explaining why a model made a specific prediction for a single instance. This is incredibly useful for understanding individual cases, debugging outliers, or providing personalized explanations to users. The two most prominent techniques in this category are LIME and SHAP.
LIME (Local Interpretable Model-agnostic Explanations) works by perturbing a single data point multiple times, generating slightly modified versions of that instance. It then trains a simple, interpretable model (like a linear regression or decision tree) on these perturbed samples and their corresponding predictions from the black-box model. The weights of this simple model reveal which features were most influential for that specific prediction. LIME is “model-agnostic,” meaning it can be applied to any black-box model.
KEY POINT
Local interpretability methods like LIME and SHAP provide insights into specific model predictions, crucial for understanding individual decisions and building trust on a case-by-case basis.
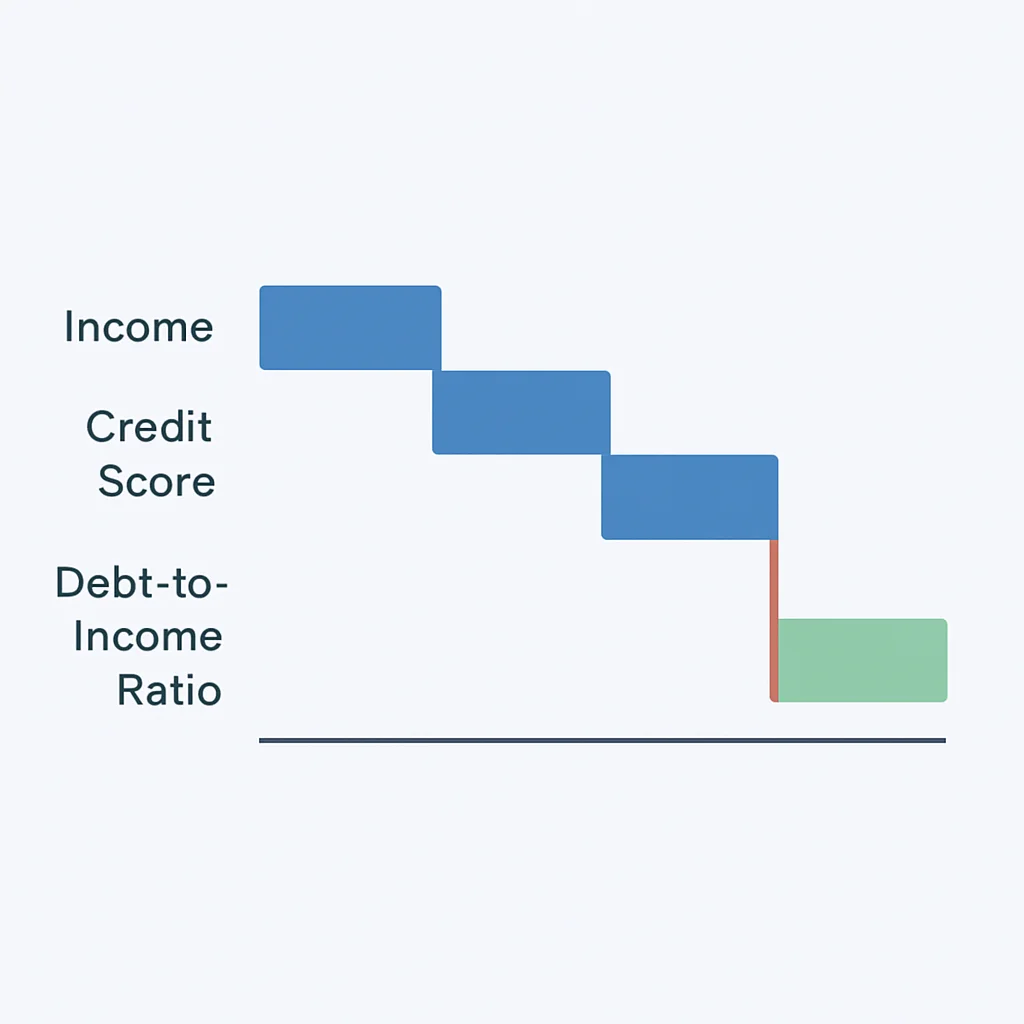
SHAP (SHapley Additive exPlanations) is arguably the most popular and theoretically sound XAI method as of 2026. It’s based on Shapley values from cooperative game theory, which fairly attribute the contribution of each feature to the prediction. For a given prediction, SHAP calculates how much each feature contributes to pushing the prediction from the baseline (e.g., the average prediction) to the actual prediction. SHAP offers consistency and local accuracy, and its unified framework allows for both local and global explanations.
Let’s look at a quick example of how you might use SHAP with a simple scikit-learn model:
CODE EXPLANATION
This Python code demonstrates how to use the SHAP library to explain a single prediction from a RandomForestClassifier trained on a synthetic dataset. It calculates SHAP values for an instance and visualizes the contribution of each feature to that specific prediction.
import shap
import numpy as np
import pandas as pd
from sklearn.model_selection import train_test_split
from sklearn.ensemble import RandomForestClassifier
from sklearn.datasets import make_classification

# 1. Generate a synthetic dataset
X, y = make_classification(n_samples=1000, n_features=10, n_informative=5, n_redundant=2, random_state=42)
feature_names = [f"feature_{i}" for i in range(X.shape[1])]
X_df = pd.DataFrame(X, columns=feature_names)

# 2. Split data and train a RandomForestClassifier (our black box model)
X_train, X_test, y_train, y_test = train_test_split(X_df, y, test_size=0.2, random_state=42)
model = RandomForestClassifier(n_estimators=100, random_state=42)
model.fit(X_train, y_train)

# 3. Choose an instance to explain (e.g., the first test instance)
instance_to_explain = X_test.iloc[0, :]
print(f"Prediction for instance 0: {model.predict(instance_to_explain.to_frame().T)[0]}")

# 4. Initialize JS for SHAP plots (important for Jupyter/notebooks)
shap.initjs()

# 5. Create a SHAP explainer for tree-based models
explainer = shap.TreeExplainer(model)

# 6. Calculate SHAP values for the chosen instance
shap_values = explainer.shap_values(instance_to_explain)

# 7. Visualize the explanation for the first class (binary classification)
# shap_values[1] refers to the SHAP values for the positive class (class 1)
# For multiclass, you'd choose the class of interest.
shap.plots.waterfall(shap.Explanation(values=shap_values[1],
                                      base_values=explainer.expected_value[1],
                                      data=instance_to_explain.values,
                                      feature_names=feature_names),
                    show=False) # show=False to prevent immediate display in non-notebook env
# In a real notebook, this would render a waterfall plot.
# For blog, we'll imagine the output.
print("\nSHAP Waterfall plot would be displayed here, showing feature contributions.")
print("Example SHAP values for positive class (first 5 features):")
for i in range(5):
    print(f"  {feature_names[i]}: {shap_values[1][i]:.4f}")
This code snippet shows how SHAP assigns a value to each feature, indicating its impact on the model’s output for a specific prediction. A positive SHAP value for a feature means it pushes the prediction towards a higher value (e.g., positive class), while a negative value pushes it lower.
Global Interpretability: Understanding Overall Model Behavior
While local explanations are great for individual cases, global interpretability aims to understand the overall behavior of the model. This means answering questions like, “Which features are generally most important?” or “How does a change in feature X typically affect the prediction?” Global explanations are vital for model validation, identifying biases, and communicating model insights to non-technical stakeholders.
Feature Importance is the simplest global method. Many models (like tree-based ensembles) provide built-in feature importance scores, often based on how much a feature reduces impurity or error across all splits. SHAP also provides a global feature importance measure by averaging the absolute SHAP values for each feature across the entire dataset.
CODE EXPLANATION
This code snippet extends the previous SHAP example to calculate and visualize global feature importance. It aggregates the absolute SHAP values across the entire dataset to show which features have the most significant overall impact on the model’s predictions.
# Continue from previous SHAP example

# 1. Calculate SHAP values for the entire test set
shap_values_test = explainer.shap_values(X_test)

# 2. Plot global feature importance (for class 1)
shap.plots.bar(shap.Explanation(values=np.abs(shap_values_test[1]).mean(0),
                                base_values=explainer.expected_value[1],
                                data=X_test.values.mean(0),
                                feature_names=feature_names),
              show=False)
print("\nSHAP Bar plot (global feature importance) would be displayed here.")

# For a more detailed global view, a SHAP summary plot is often used:
# shap.plots.summary_plot(shap_values_test[1], X_test, show=False)
# print("\nSHAP Summary plot would also be displayed here for global insights.")

print("\nTop 3 Global Features by Mean Absolute SHAP Value (Class 1):")
mean_abs_shap_values = np.abs(shap_values_test[1]).mean(0)
global_importance = pd.Series(mean_abs_shap_values, index=feature_names).sort_values(ascending=False)
print(global_importance.head(3))
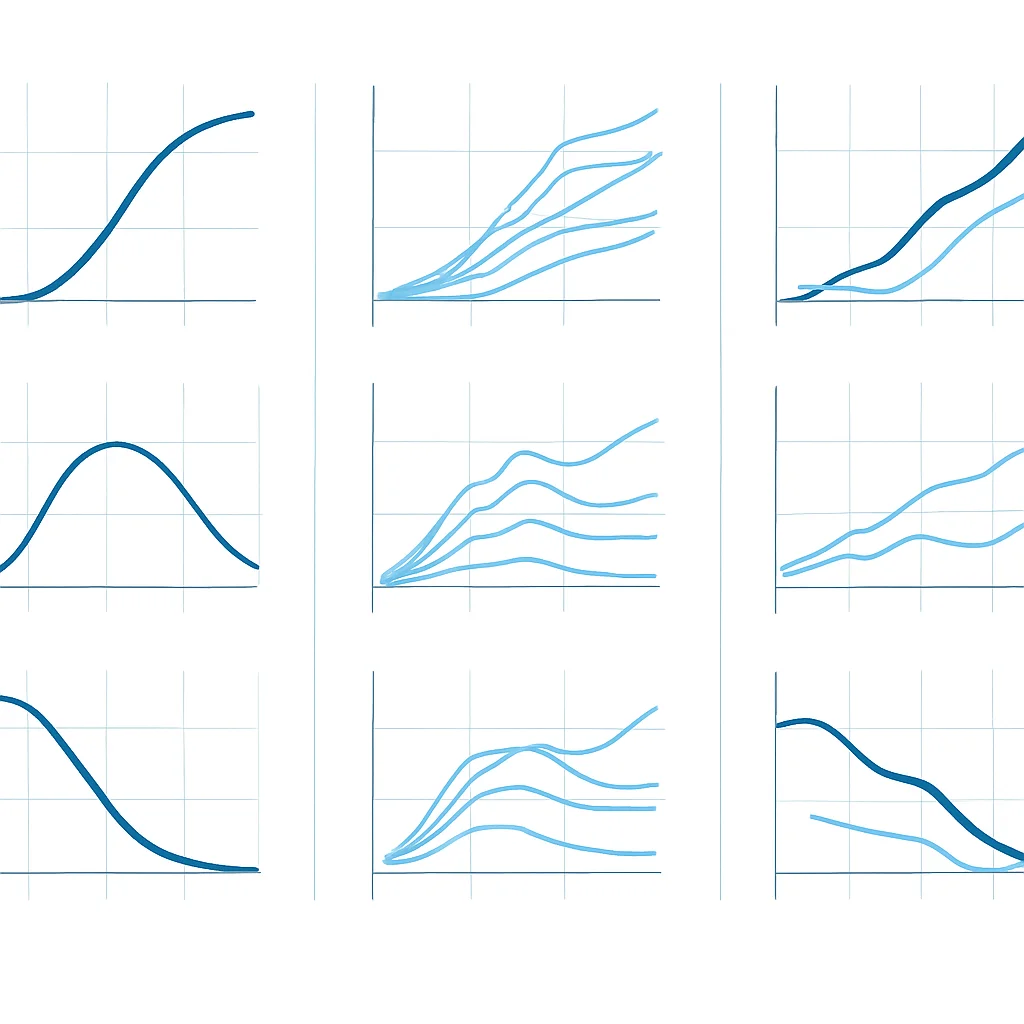
Partial Dependence Plots (PDPs) show the marginal effect of one or two features on the predicted outcome of a model. They illustrate how the prediction changes on average as the feature value varies. For example, a PDP for “age” might show that the probability of loan default decreases significantly between ages 30 and 50, then plateaus.
Individual Conditional Expectation (ICE) Plots are similar to PDPs but show the dependence for each instance separately, rather than an average. This can reveal heterogeneous relationships that might be hidden by the averaging effect of PDPs. For instance, an ICE plot might show that for some individuals, the probability of loan default increases with age, while for others it decreases, depending on their other features.
KEY POINT
Global interpretability methods like SHAP summary plots, PDPs, and ICE plots help understand the overall model behavior, identify general feature relationships, and detect potential biases across the dataset.
Model-Specific vs. Model-Agnostic Techniques
It’s important to distinguish between model-specific and model-agnostic XAI approaches:
Model-Specific techniques leverage the internal structure of a particular model type. Examples include built-in feature importance for tree-based models, or analyzing weights in linear models. These are often highly efficient but only work for specific model architectures.
Model-Agnostic techniques treat the model as a black box and interact with it only through its inputs and outputs. LIME, SHAP, PDPs, and ICE plots generally fall into this category. This flexibility means they can be applied to virtually any machine learning model, regardless of its complexity or underlying algorithm, making them incredibly versatile.
“The beauty of model-agnostic XAI is its universality. You can swap out a neural network for a gradient boosting machine, and your interpretability workflow largely remains intact.”
— Data Science Lead, TechCorp
Comparison of Key XAI Techniques
Here’s a comparative overview of the techniques discussed:
| Technique | Type | Scope | Pros | Cons |
|---|---|---|---|---|
| LIME | Model-Agnostic | Local | Intuitive, works for any model, visual explanations. | Can be unstable, depends on neighborhood definition. |
| SHAP | Model-Agnostic (with optimizations for specific models) | Local & Global | Theoretically sound (Shapley values), consistent, unified framework. | Computationally intensive for exact values, approximations needed for complex models. |
| PDP | Model-Agnostic | Global | Shows average effect of features, easy to understand. | Can mask heterogeneous effects, assumes feature independence. |
| ICE Plots | Model-Agnostic | Local (aggregated for global insight) | Reveals individual conditional effects, detects heterogeneity. | Can be overwhelming for many instances, harder to interpret overall trends. |
PROBLEM SOLVING
Navigating XAI Challenges: Solutions for Developers
While XAI offers immense benefits, its implementation isn’t without hurdles. Developers frequently encounter challenges related to computational cost, the inherent trade-off between interpretability and accuracy, and the potential for misinterpreting explanations. Understanding these pitfalls and their solutions is key to successful XAI integration.
PROBLEM 01
Computational Overhead
Many XAI techniques, especially model-agnostic ones like SHAP and LIME, require repeated calls to the black-box model. This can become computationally expensive, particularly for large datasets, complex models (e.g., deep learning), or real-time applications where explanations are needed instantaneously.
SOLUTION — Optimize and Approximate
1. Sampling and Subset Explanations: Instead of explaining every single prediction, focus on a representative sample or critical instances (e.g., misclassified points, high-risk predictions). For global explanations, use a smaller, representative subset of the data.
2. Optimized Explainers: Leverage optimized SHAP explainers like TreeExplainer for tree-based models or DeepExplainer for neural networks, which are significantly faster than the general KernelExplainer.
3. Pre-computation: For static models, pre-compute explanations for common scenarios or critical data points and store them. This allows for quick retrieval during inference.
# Example of using TreeExplainer for efficiency
# (Assuming 'model' is a RandomForestClassifier and X_train is the training data)
# explainer = shap.TreeExplainer(model)
# shap_values = explainer.shap_values(X_test) # Much faster than KernelExplainer
PROBLEM 02
Interpretability vs. Accuracy Trade-off
Often, the most interpretable models (e.g., linear regression, decision trees) are not the most accurate, especially for complex, non-linear relationships. Conversely, highly accurate models (e.g., deep learning, large ensembles) tend to be less interpretable. This creates a dilemma for developers who need both performance and transparency.
SOLUTION — Hybrid Approaches and Post-hoc Explanations
1. Post-hoc Explanations: Use model-agnostic XAI techniques (LIME, SHAP, PDPs) on your black-box models. These allow you to maintain high accuracy while gaining interpretability after the model has been trained. This is the most common approach in 2026.
2. Inherently Interpretable Models: For use cases where accuracy is less critical or regulatory requirements are extremely strict, consider using inherently interpretable models or “glass-box” models like Generalized Additive Models (GAMs) or sparse linear models.
3. Model Distillation: Train a simpler, interpretable model to mimic the behavior of a complex black-box model. The simpler model can then be explained directly, offering a proxy for the complex model’s reasoning.
PROBLEM 03
Misinterpretation of Explanations
XAI tools provide insights, but these insights are not always straightforward or perfectly reflective of true causality. Explanations can be sensitive to hyperparameter choices, data perturbations, or even the choice of XAI method itself. Users (even developers) might misinterpret correlation as causation, or assume an explanation is globally true when it’s only locally valid.
SOLUTION — Contextualize and Validate
1. Education and Training: Provide clear documentation and training for anyone interpreting XAI outputs. Emphasize that explanations show feature influence, not necessarily direct causality.
2. Combine Methods: Use multiple XAI techniques and look for consistent patterns. For example, if both LIME and SHAP highlight the same features for a prediction, confidence in that explanation increases.
3. Domain Expert Validation: Always involve domain experts to validate explanations. If an explanation contradicts domain knowledge, it’s a red flag for potential model issues or misinterpretation.
4. Explainability Dashboards: Present explanations in interactive dashboards that allow users to explore different instances, filter by features, and understand the context of the explanation. Libraries like InterpretML provide such capabilities.
KEY POINT
Addressing XAI challenges involves optimizing computation, employing post-hoc explanations to balance accuracy and interpretability, and carefully contextualizing explanations to prevent misinterpretation, often requiring collaboration with domain experts.
PRACTICAL APPLICATION
Practical XAI: Integrating Interpretability into Your Workflow
Now that we’ve covered the “what” and “why” of XAI, let’s delve into the “how.” Integrating XAI effectively means thinking about interpretability throughout the entire machine learning lifecycle, not just as an afterthought. Here’s a guide to practical application.
Integrating XAI into the ML Workflow
Consider these stages for XAI integration:
1
Pre-modeling (Data Exploration & Feature Engineering)
Use simple interpretable models or correlation analyses to understand feature relationships before building complex models. This helps establish a baseline understanding and identify potential biases early on. For example, using pandas.corr() to identify highly correlated features.
2
Model Training & Validation
Apply global XAI methods (e.g., SHAP summary plots, PDPs) to the trained model to ensure it’s learning expected patterns. Identify if the model is relying on spurious features or exhibiting unexpected behavior. This helps in iterating on model design and hyperparameter tuning.
3
Deployment & Monitoring
Implement local XAI methods (e.g., SHAP waterfall plots for individual predictions) to provide explanations in production environments. This is crucial for user trust, regulatory compliance, and real-time debugging. Continuously monitor explanations for drift or unexpected shifts in feature importance over time, which could indicate data quality issues or concept drift.
KEY POINT
Integrating XAI throughout the ML lifecycle, from data exploration to deployment and monitoring, ensures proactive identification of biases, robust model validation, and transparent decision-making in production.
Key Tools and Libraries
The XAI ecosystem has matured significantly by 2026, offering robust tools for various needs:
Essential XAI Libraries
SHAP — For unified local and global explanations based on Shapley values. Widely adopted and highly recommended.
LIME — Provides local, interpretable explanations by approximating the black box locally with a simpler model.
InterpretML — A Microsoft library that combines multiple XAI techniques (including GAMs, EBMs, LIME, SHAP) into an interactive dashboard, ideal for comprehensive analysis.
ELI5 — A Python library for inspecting and debugging machine learning classifiers and regressors, offering built-in explainers for various models.
Fairlearn — While not strictly XAI, Fairlearn (also by Microsoft) helps assess and mitigate unfairness in AI systems, often used in conjunction with XAI to understand and address biased explanations.
Case Study: XAI in Healthcare Diagnostics
Let’s consider a hypothetical scenario in healthcare. A major hospital system in 2026 deploys an AI model to predict the likelihood of a patient developing a rare condition within the next 12 months, based on their electronic health records (EHR). The model achieves 92% accuracy, significantly outperforming traditional methods. However, clinicians need to understand why a patient is flagged as high-risk before making treatment recommendations.
The XAI Implementation:
The development team integrated SHAP into their diagnostic pipeline. For each patient flagged as high-risk, a SHAP waterfall plot is generated and presented in the clinician’s dashboard. For instance, for Patient A, the model predicts a 75% risk. The SHAP explanation reveals that “Elevated C-reactive protein (CRP) levels” contributed +25% to the risk, “Family history of autoimmune disease” contributed +15%, and “Age (58 years)” contributed +10%. Conversely, “Regular exercise regimen” contributed -5%.
Impact:
- • Clinical Trust: Clinicians can now see the contributing factors, aligning with their medical knowledge. This boosts their confidence in the AI’s recommendations.
- • Targeted Interventions: For Patient A, the clinician can focus on further tests related to inflammation (CRP) and discuss family history, leading to more personalized and effective preventive care.
- • Bias Detection: During model validation, global SHAP plots revealed that for a specific demographic, the model was over-relying on a proxy feature (e.g., zip code) instead of direct medical indicators. This allowed the data science team to re-engineer features and retrain the model to mitigate bias.
- • Regulatory Compliance: The hospital can demonstrate to health authorities that their AI systems are transparent and provide auditable explanations for high-stakes decisions, fulfilling emerging regulatory requirements.
This case highlights how XAI transforms a powerful but opaque predictive tool into a transparent, trustworthy, and actionable diagnostic aid, directly impacting patient care and operational ethics.

Frequently Asked Questions About XAI
Q. What is the primary goal of Explainable AI (XAI)?
The primary goal of XAI is to make AI models more understandable to humans by providing insights into their decision-making processes, thereby increasing transparency, trust, and accountability.
Q. Are XAI techniques model-specific or model-agnostic?
XAI techniques can be both. Model-specific methods leverage a model’s internal structure, while model-agnostic methods treat the model as a black box and can be applied to any type of machine learning model.
Q. How does XAI help with debugging AI models?
XAI helps with debugging by revealing which features or patterns are driving incorrect predictions, allowing developers to identify issues in data, feature engineering, or model architecture more efficiently.
Q. Can XAI completely solve the problem of AI bias?
XAI can help identify and quantify biases by showing which sensitive features disproportionately influence predictions. However, it doesn’t automatically solve bias; mitigation strategies and ethical considerations are still required in conjunction with XAI insights.
Q. What is the difference between local and global interpretability?
Local interpretability explains a single prediction (e.g., why a specific loan was denied), while global interpretability aims to understand the overall behavior of the model across all predictions (e.g., which features are generally most important for loan approval).
WRAP-UP
Conclusion: The Future of Transparent AI
As we navigate 2026, the journey towards truly responsible AI is inextricably linked with the advancements and widespread adoption of Explainable AI. We’ve seen that XAI is far more than a compliance checkbox; it’s a fundamental shift in how we approach AI development, fostering trust, enabling robust debugging, and promoting ethical considerations from inception to deployment. From local explanations that illuminate individual decisions to global insights that reveal overall model behavior, XAI empowers developers to transform opaque algorithms into transparent, understandable systems.
“The future of AI is not just intelligent, but intelligible. XAI is the bridge between raw computational power and human comprehension, essential for widespread adoption and societal benefit.”
— Kwonglish, 2026
The challenges of computational overhead, the accuracy-interpretability trade-off, and the potential for misinterpretation are real, but as demonstrated, practical solutions and best practices exist. By strategically applying optimized XAI methods, leveraging hybrid approaches, and always contextualizing explanations, developers can effectively mitigate these issues.
Looking ahead, we can expect XAI to become even more integrated into standard ML platforms, with increasing focus on multimodal explanations (e.g., explaining vision models with natural language), causality-aware XAI, and the development of intuitive user interfaces for non-technical users. Regulatory frameworks will continue to evolve, making XAI a non-negotiable component of any high-stakes AI application.
For developers, embracing XAI means building more robust, ethical, and ultimately more valuable AI systems. It’s about moving beyond mere predictions to provide meaningful understanding. So, go forth, demystify those black boxes, and build the transparent AI of tomorrow!
Thanks for reading!
We hope this deep dive into Explainable AI equips you with the tools and insights to build more transparent and trustworthy models in 2026 and beyond.
Got questions about XAI, or want to share your own experiences? Drop a comment below!